
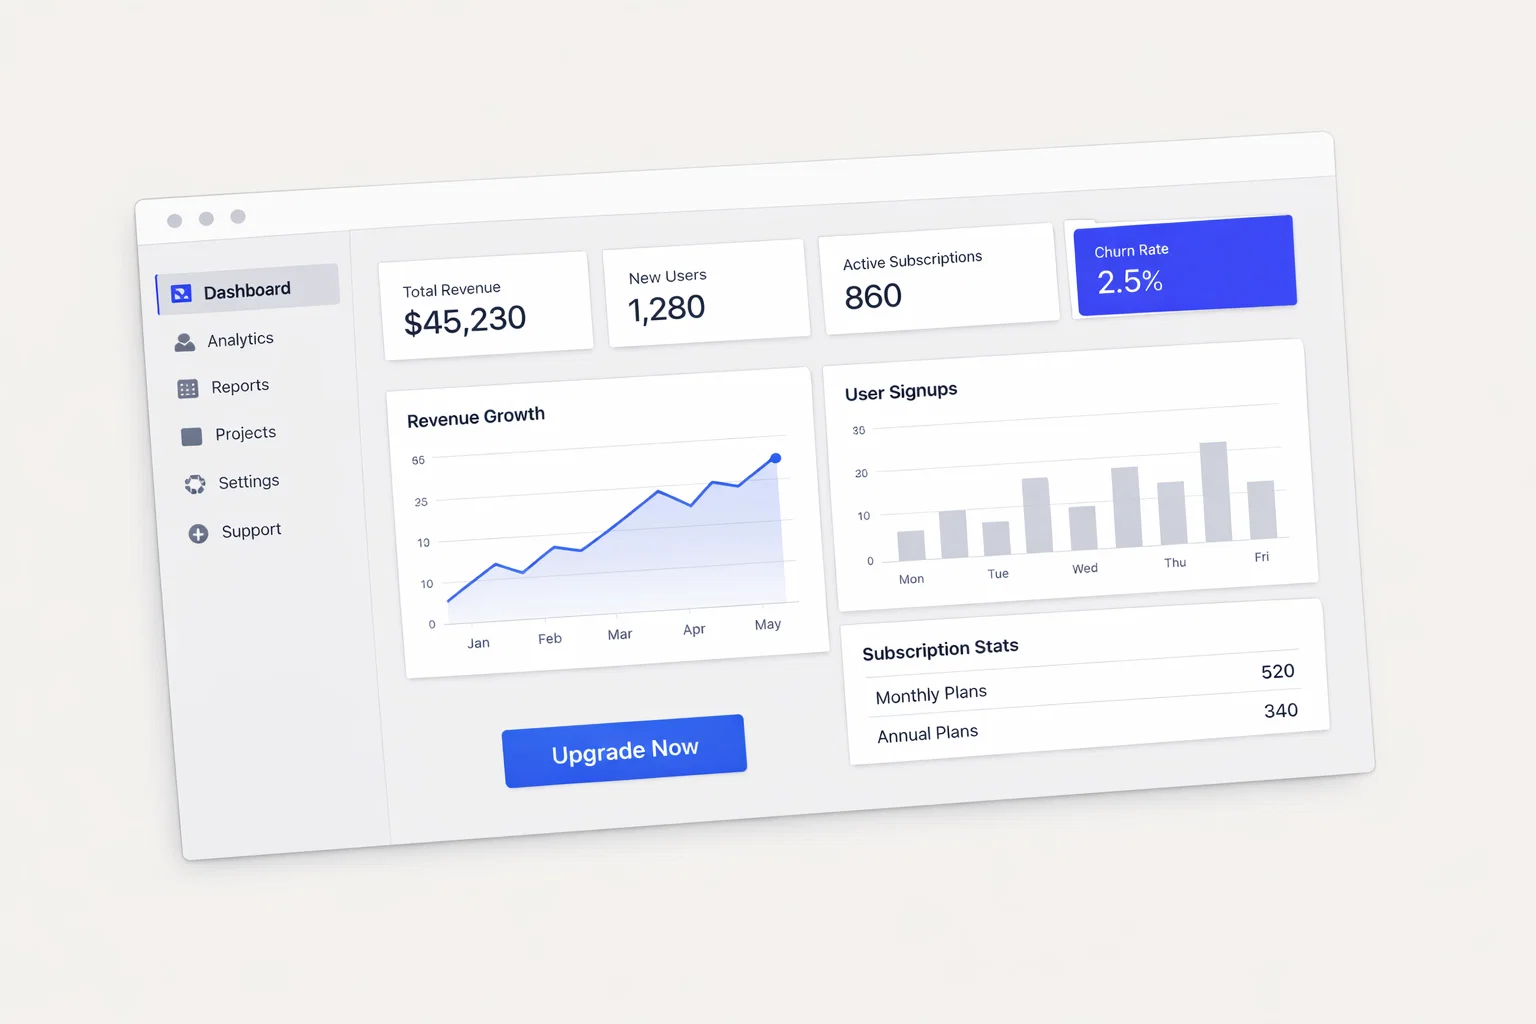
This guide provides a professional framework for evaluating and allocating capital to the Quantitative Trading and FinTech Application sector. In the 2025–2026 market cycle, the transition from traditional brokerage models to AI-integrated, high-frequency execution platforms has redefined capital market participation.
Universal Investment Guide: How to Invest in Quantitative Trading Platforms & FinTech Systems
Investing in financial technology applications and quantitative systems requires a dual understanding of software-as-a-service (SaaS) metrics and capital market mechanics. Unlike traditional equities, the value of these platforms is derived from their ability to capture order flow, manage data latency, and provide superior risk-adjusted signals.
Strategic Executive Summary
The investment thesis for quantitative platforms rests on the increasing “algorithmic density” of global markets. As of 2026, over 80% of daily trading volume is executed via automated systems. Investors seeking exposure to this niche are betting on the infrastructure that facilitates this liquidity.
| Metric | Assessment | Comment |
| Risk Level | High / Speculative | Driven by rapid technological obsolescence and regulatory shifts. |
| Return Profile | Asymmetric | High growth potential during volatility expansions. |
| Time Horizon | 3–7 Years | Required to capture full platform scaling and adoption cycles. |
| Liquidity | High (Public) / Low (Private) | Public ETFs provide instant liquidity; private equity is locked. |
Core Drivers: Increasing retail algorithmic participation, T+1 settlement integration, and AI-driven predictive analytics.- Target Investor: Institutional allocators or sophisticated retail investors focused on “Growth at a Reasonable Price” (GARP) with a high tech-sensitivity.
The Nature of FinTech and Algorithmic Trading Systems
The economic logic of this niche is centered on disintermediation. Quantitative platforms remove the “human friction” from trading, allowing for tighter spreads and faster execution. Revenue is typically generated through subscription fees (SaaS), payment for order flow (PFOF), or performance-based carry in managed accounts.
- Revenue Model: Shift from transactional commissions to recurring API-access fees.
- Historical Performance: High correlation with market volatility ($VIX$) rather than directional market moves.
- Cyclicality: Often counter-cyclical; these platforms see higher engagement during periods of market stress and high turnover.
Macroeconomic Drivers Affecting the Sector (2025–2026)
The normalization of interest rates in 2025 has shifted the focus from “growth at any cost” to profitability and cash flow margins. Quantitative platforms are highly sensitive to the cost of compute and the regulatory environment regarding data privacy.
| Macro Factor | Impact Direction | Sensitivity Level |
| Interest Rates | Inverse | High (Affects discounting of future cash flows). |
| Market Volatility | Positive | Moderate (Increases platform usage and spreads). |
| Regulatory Tightening | Negative | Very High (Potential bans on specific AI-trading models). |
| USD Strength | Mixed | Low (Mainly impacts global platform expansion). |
GDP Growth: Moderate impact; platform growth depends more on financialization than broad industrial output.- Inflation Dynamics: Increases operational costs (talent/data centers) but can drive higher trading volumes as investors rebalance frequently.
Market Structure of FinTech Applications
The market is currently categorized by a “Barbell Structure”: a few dominant institutional giants (e.g., Bloomberg, Citadel-tier tech) and a fragmented tail of innovative, AI-native retail applications.
- Key Participants: Tier-1 banks, independent software vendors (ISVs), and decentralized finance (DeFi) aggregators.
- Entry Barriers: Massive R&D requirements, cybersecurity compliance, and the “network effect” of liquidity.
- Regulatory Oversight: Dominated by SEC, FINRA (US), and ESMA (EU) frameworks focusing on “Algorithmic Transparency.”
Investment Vehicles for Gaining Exposure
Investors can access this niche through various structures, ranging from liquid public equities to illiquid venture capital.
| Vehicle | Liquidity | Cost | Risk Level | Suitable For |
| Public Equities | Daily | Low | Moderate | Diversified Portfolios |
| Thematic ETFs | Daily | 0.45%–0.75% | Moderate | General Retail/Institutional |
| Private Equity | Low (5yr+) | High | Very High | Ultra High Net Worth (UHNW) |
| Direct App Usage | High | Variable | High | Active Traders |
Selection: Identify whether you want exposure to the provider (the company) or the strategy (the app’s output).- Due Diligence: Audit the platform’s execution speed (latency) and historical drawdown profiles.
- Allocation: Deploy capital via staggered entry (DCA) to mitigate timing risk in a volatile sector.
Fundamental Analysis Framework
When evaluating a quantitative trading application or company, traditional P/E ratios are often insufficient. One must look at technical efficiency and user retention.
| Valuation Metric | Formula/Definition | Target Range (2026) |
| EV / Revenue | Enterprise Value / Annual Revenue | 5x – 12x (Sector average) |
| CAC / LTV Ratio | Customer Acquisition Cost / Lifetime Value | > 3.0x |
| Churn Rate | Annual user loss percentage | < 15% |
| Latency (ms) | Execution speed in milliseconds | < 10ms for competitive edge |
Competitive Positioning: Does the platform have proprietary data feeds or unique AI training sets?- Supply-Demand: The demand for “alpha-generating” tools is infinite, but the supply of effective tools is scarce.
Technical and Quantitative Evaluation
For liquid fintech stocks or active trading systems, statistical indicators help time entries and manage “Model Risk.”
- Trend Analysis: Utilizing 50-day and 200-day Exponential Moving Averages (EMA).
- Volatility Metrics: Monitoring the standard deviation of daily returns to ensure the system stays within its “Value at Risk” ($VaR$) limits.
- Risk-Adjusted Indicators: Emphasis on the Sortino Ratio over the Sharpe Ratio to focus on downside volatility.
Note on Model Decay: Quantitative strategies often suffer from “alpha erosion” as more participants adopt similar algorithms. Continuous R&D is a mandatory capital expenditure.
Risk Assessment in FinTech Investing
The primary risk in 2026 is no longer just market direction, but Systemic Execution Risk.
| Risk Type | Probability | Impact | Mitigation Strategy |
| Model Risk | Moderate | High | Regular backtesting and “Human-in-the-loop” oversight. |
| Cybersecurity | High | Catastrophic | Robust encryption and cold-storage of sensitive API keys. |
| Regulatory | Moderate | Moderate | Diversification across multiple jurisdictions (US, EU, Singapore). |
| Liquidity Risk | Low | Moderate | Ensure platform uses multiple Tier-1 liquidity providers. |
Portfolio Allocation Strategy
FinTech and quantitative systems should typically be treated as a Satellite Allocation within a broader Growth or Aggressive strategy.
- Strategic Range: 5%–15% of total AUM.
- Correlation: These assets often show low correlation to Fixed Income, providing a diversification benefit.
- Rebalancing: Quarterly rebalancing is recommended to harvest gains from high-volatility “spikes.”
Allocation Scenarios
| Investor Type | Allocation % | Role in Portfolio |
| Conservative | 2% | Minimal “Alpha” kicker. |
| Moderate | 7% | Diversification and growth capture. |
| Aggressive | 15%+ | Primary driver of capital appreciation. |
Taxation, Legal, and ESG Considerations
- Taxation: High-frequency platforms can generate significant short-term capital gains, which are taxed at higher rates than long-term holdings.
- Legal: Compliance with “Know Your Customer” (KYC) and Anti-Money Laundering (AML) is non-negotiable for platform longevity.
- ESG: The “E” (Environmental) factor is increasingly relevant due to the high electricity consumption of AI data centers.
| ESG Factor | Relevance | Risk Level |
| Carbon Footprint | Moderate | Rising (Carbon taxes on data centers). |
| Algorithmic Bias | High | High (Legal liability for unfair execution). |
| Data Privacy | Very High | Critical (GDPR/CCPA compliance). |
Implementation Roadmap
- Define Objective: Are you seeking capital gains (stock appreciation) or cash flow (yield from trading)?
- Risk Profiling: Determine the maximum acceptable drawdown ($MaxDD$).
- Platform Selection: Choose a tool with transparent “White Box” logic rather than “Black Box” promises.
- Position Sizing: Never allocate more than 2% of total capital to a single quantitative “signal.”
- Monitoring: Audit execution logs weekly to ensure no “style drift” has occurred.
Appendix: Metrics and Analytical Tools
To calculate the efficiency of a quantitative investment, use the following formulas:
1. Sharpe Ratio (Risk-Adjusted Return):
$$S_a = \frac{E[R_a – R_b]}{\sqrt{var(R_a – R_b)}}$$
(Where $R_a$ is asset return and $R_b$ is the risk-free rate)
2. Maximum Drawdown (MaxDD):
$$MaxDD = \frac{P – L}{P}$$
(Where $P$ is the peak value and $L$ is the lowest value before a new peak)
- Data Sources: Bloomberg Terminal, Refinitiv Eikon, Quandl (Alternative Data).
- Benchmarks: Nasdaq FinTech Index (KFTX), S&P 500 Technology Sector.
Frequently Asked Questions
- What is the minimum capital required? For public equities, as little as $100. For private quantitative funds, typically $250,000+.
- Is AI trading safe? It is efficient, but not “safe.” It eliminates emotional bias but introduces “Flash Crash” and “Model Decay” risks.
- How often should I check my investment? While these systems are automated, a monthly performance review and a quarterly structural audit are institutional standards.
What is the biggest mistake to avoid? Over-leveraging a system based on “backtested” results that may not hold up in live, “forward-tested” market conditions.